
Page 41 - 2018 Overland Park Police Department Annual Report - Thursday
P. 41
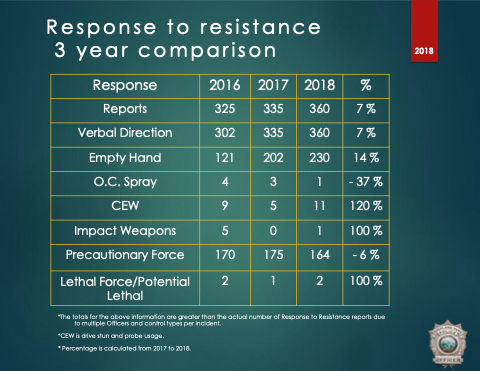
  Response to resistance 3 year comparison
       Response
2016
2017
2018
%
Reports
325
335
360
7%
Verbal Direction
302
335
360
7%
Empty Hand
121
202
230
14 %
O.C. Spray
4
3
1
- 37 %
CEW
9
5
11
120 %
Impact Weapons
5
0
1
100 %
Precautionary Force
170
175
164
-6 %
Lethal Force/Potential Lethal
2
1
2
100 %
           *The totals for the above information are greater than the actual number of Response to Resistance reports due to multiple Officers and control types per incident.
*CEW is drive stun and probe usage.
* Percentage is calculated from 2017 to 2018.
  2018
